 Genially
Improve engagement through the creation process
...
About Genially
Genially↗ is a web-based platform that allows users to create interactive and visually appealing content such as presentations, infographics, interactive images, and more.
My role
Product Designer
Responsabilities
Discovery, Research, Task prioritisation, UX/UI, Development monitoring and testing.
Overview
In Q2 2023, the main goal of Genially's engagement squad was to increase the number of creations, which is directly related to retention and activation.
-
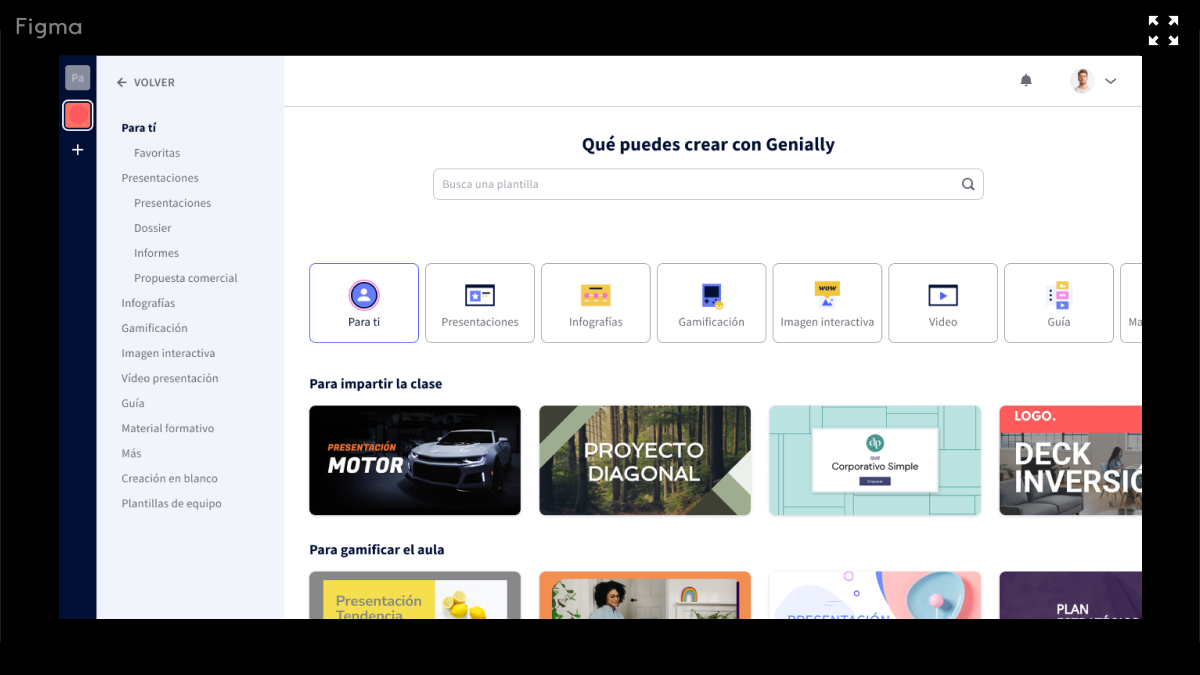
To create a presentation, the user needs to go through a multi-step process where he/she needs to make several decisions, choose the location, the type of document and the structure of the content.
This process has not been analysed in depth and its construction and maintenance has been based on internal inputs and focused on small changes without having a complete view of the funnel.
Challenge
Increase the number of creations per user.
Current metric: 2.2 creations per active user.
Understand
In order to obtain relevant data to identify opportunities and/or problems, we had several conversations with stakeholders, analysed quantitative data, checked if there was information previously collected by other squads or depts and did 6 interviews.

From all of this, we obtained some relevant data to identify opportunities and problems.
User flow

Relevant data
x2
Users who use templates have twice the retention rate
38%
of users drop out in the second step of the creation process
The wide range of templates is one of the differential values of Genially
3 out of 10
users do not make any edits on the template
Users like to use templates but find it difficult to choose the right one
4 ′ 30 ″
average user time per session to complete the creation process
Define
Having contextualised the challenge and objectives, the squad processed the information to decide where to focus.
-
As the majority of users (80%) used templates, the metrics and ratings improved with the use of templates, and as there had never been an in-depth analysis of the UX of this flow, we decided to focus and learn more about the value templates bring to the user and how they influence the creation process.
Formulating hypotheses
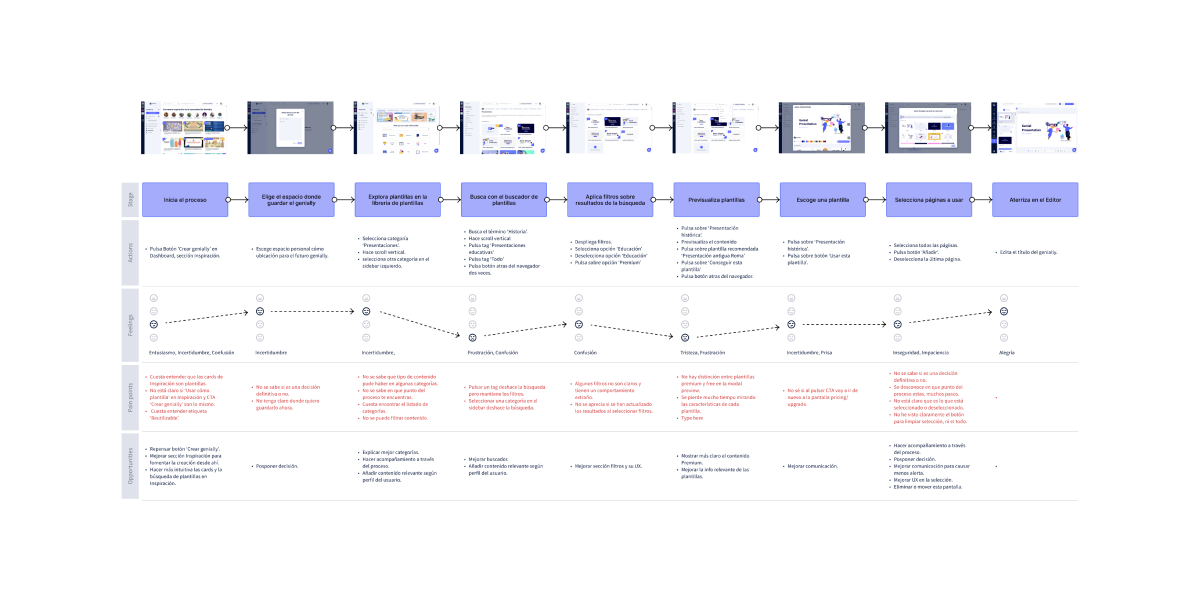
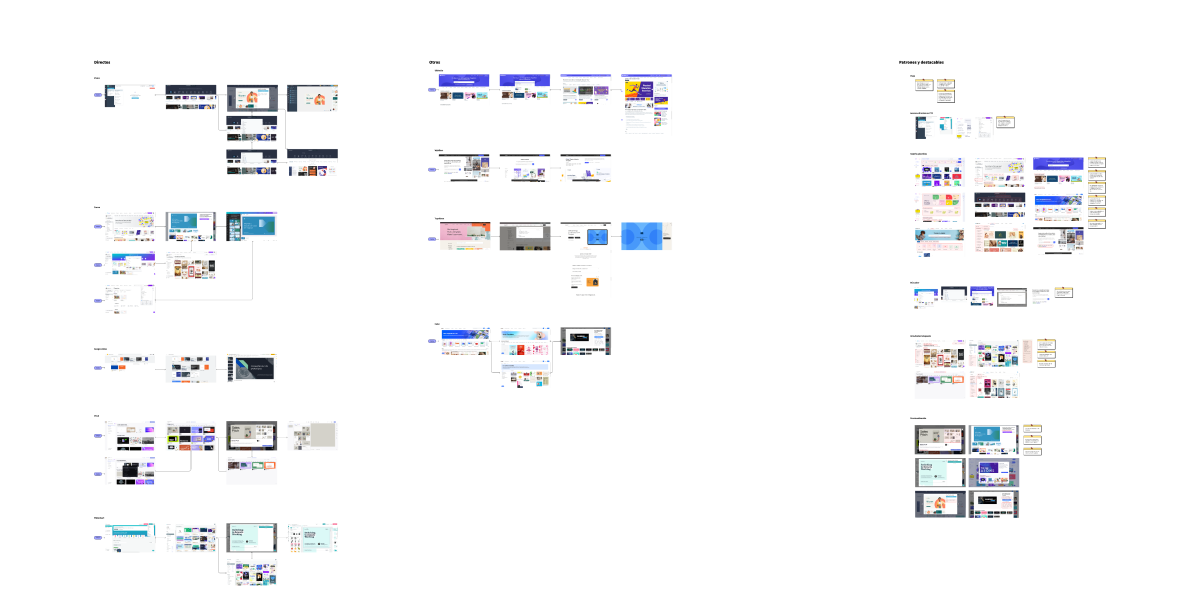
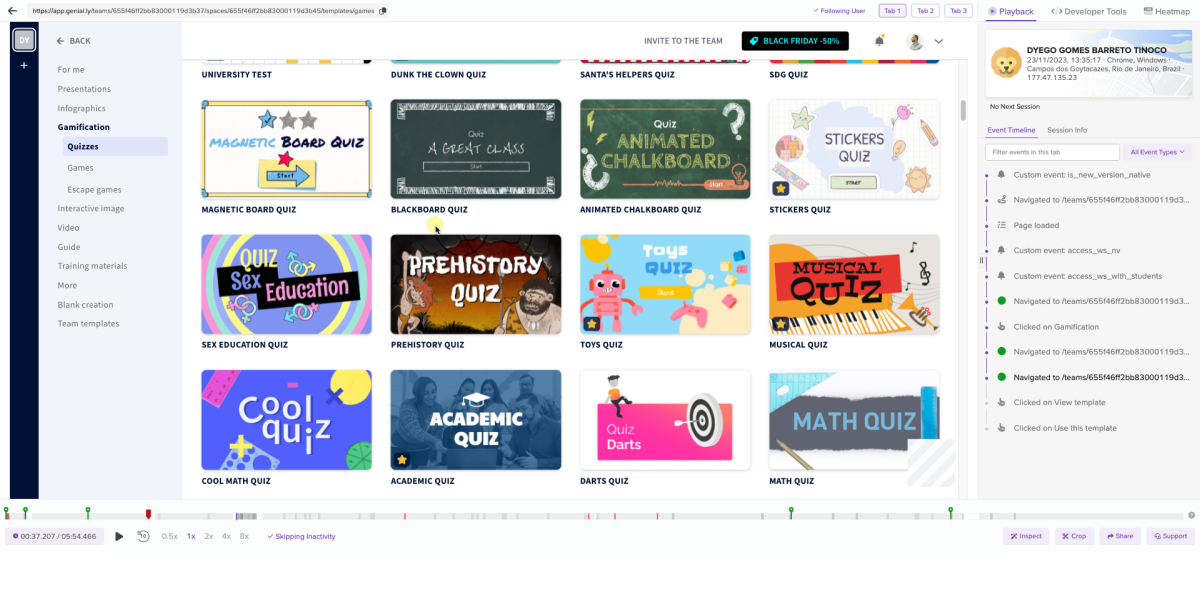
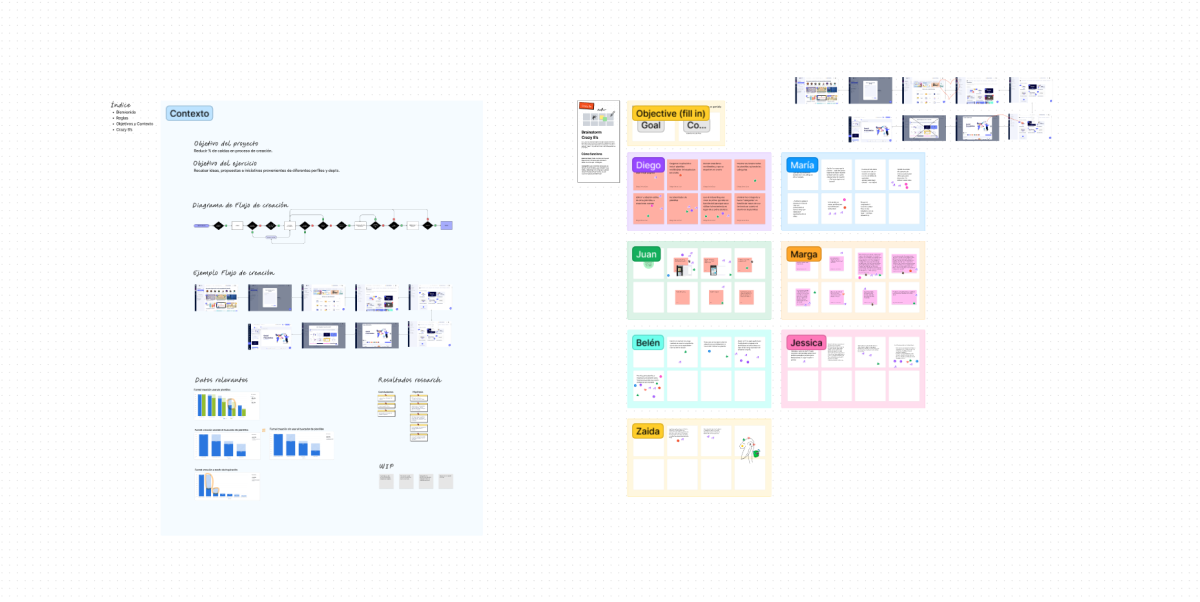
To facilitate hypothesis generation, I analysed user flows, created a journey map, watched recorded sessions and did a competitive analysis and heuristic test. I also facilitated a brainstorming session with stakeholders using the Crazy 8's method.

Analysis of User flows
Journey map
Competitive analysis
Heuristic test
Viewing user sessions
Crazy 8’s
Some screenshots of the research exercises
Hypothesis
During the research we formulated several hypotheses and, after analyzing the impact, confidence and effort of each of them, we decided to choose the hypothesis related to the option of saving the templates that are useful to you as the option with the best chance of success.
-
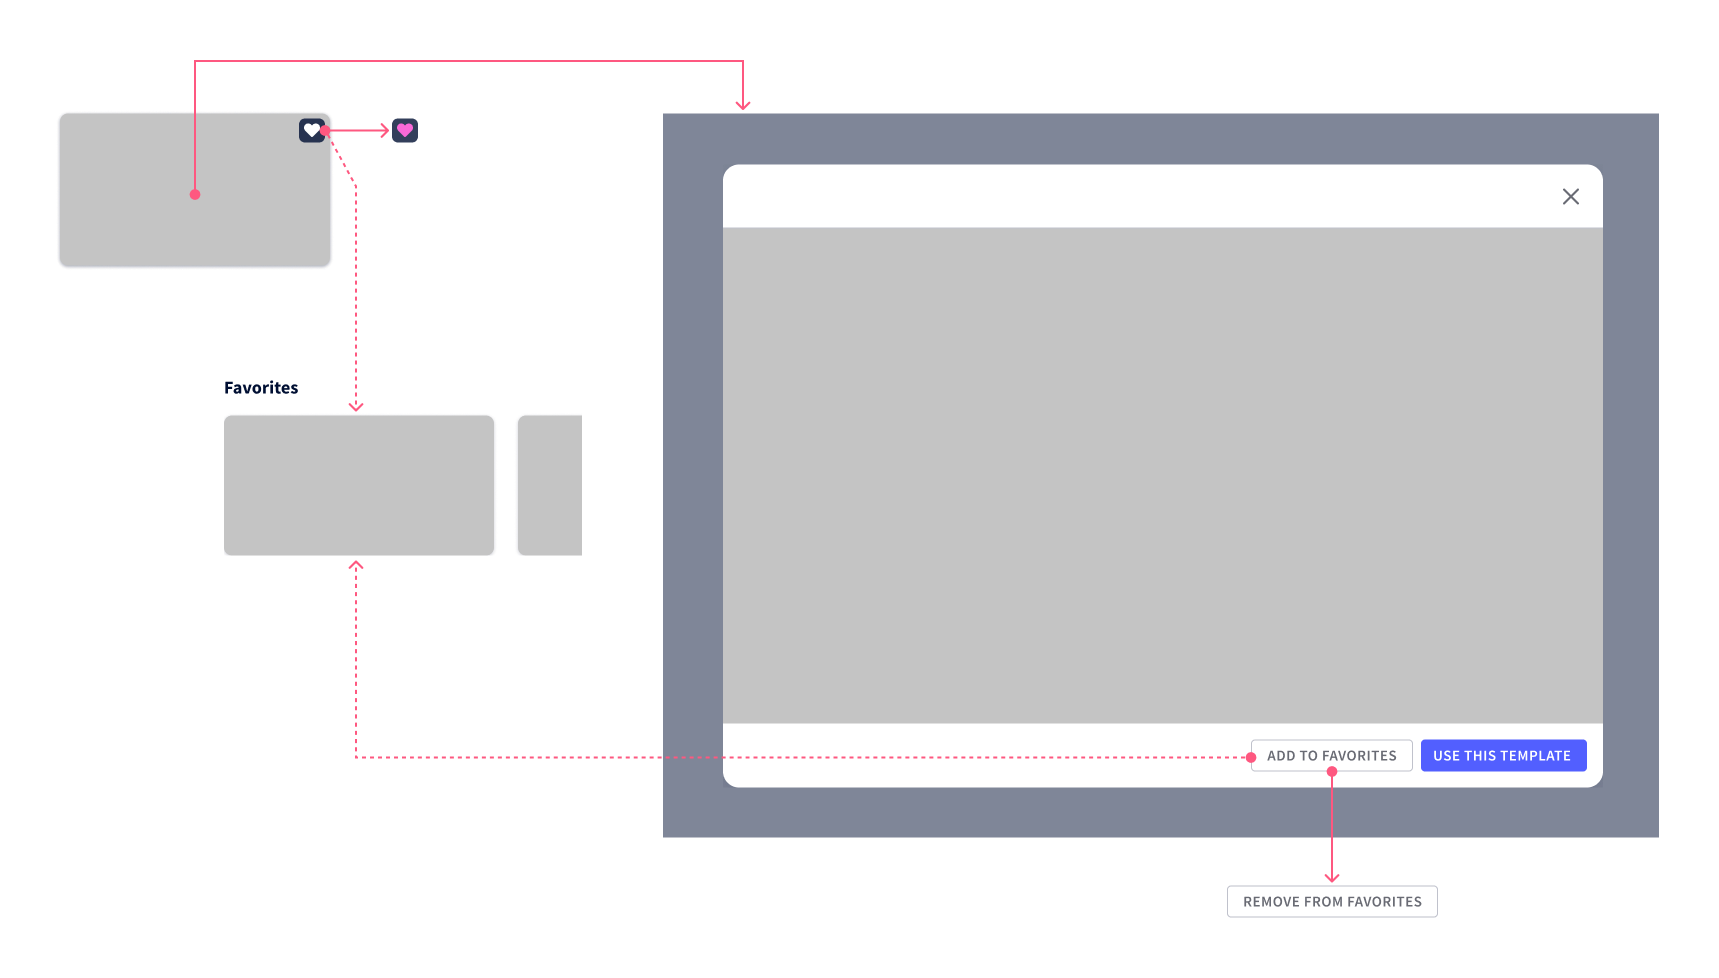
"If we allow the user to bookmark templates during exploration reduces selection time, accelerates the creation process and reduces abandonment rates."
Output
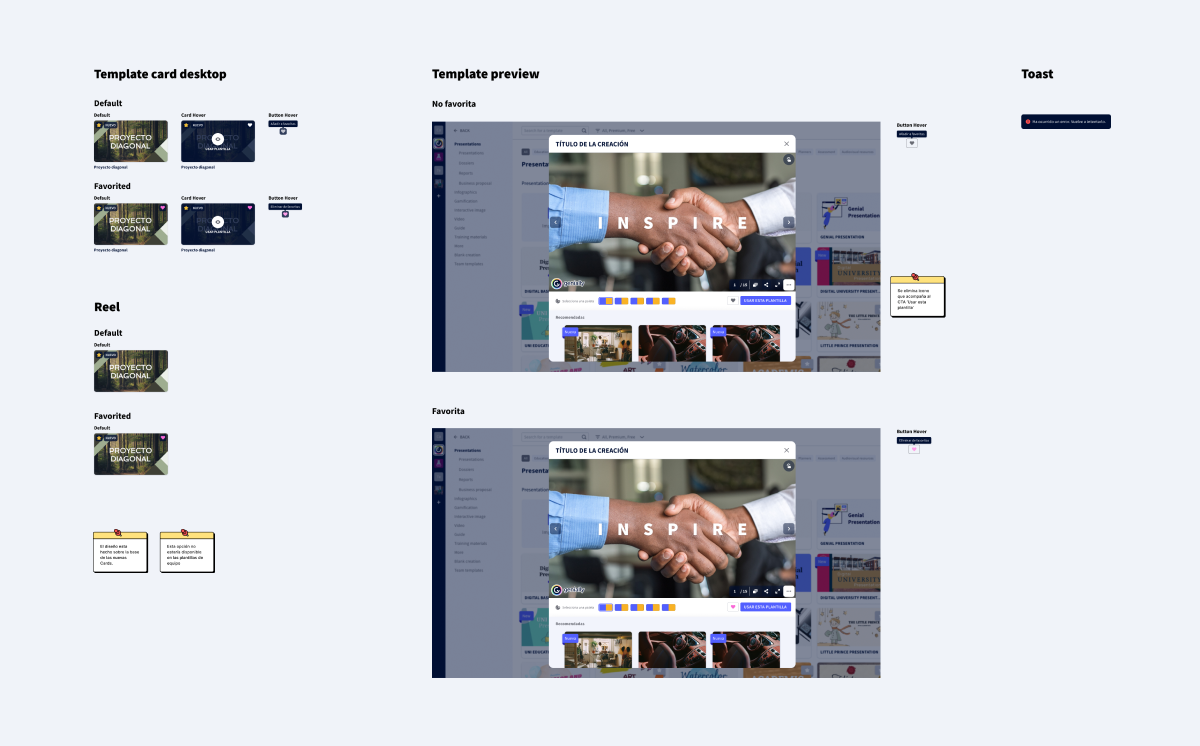
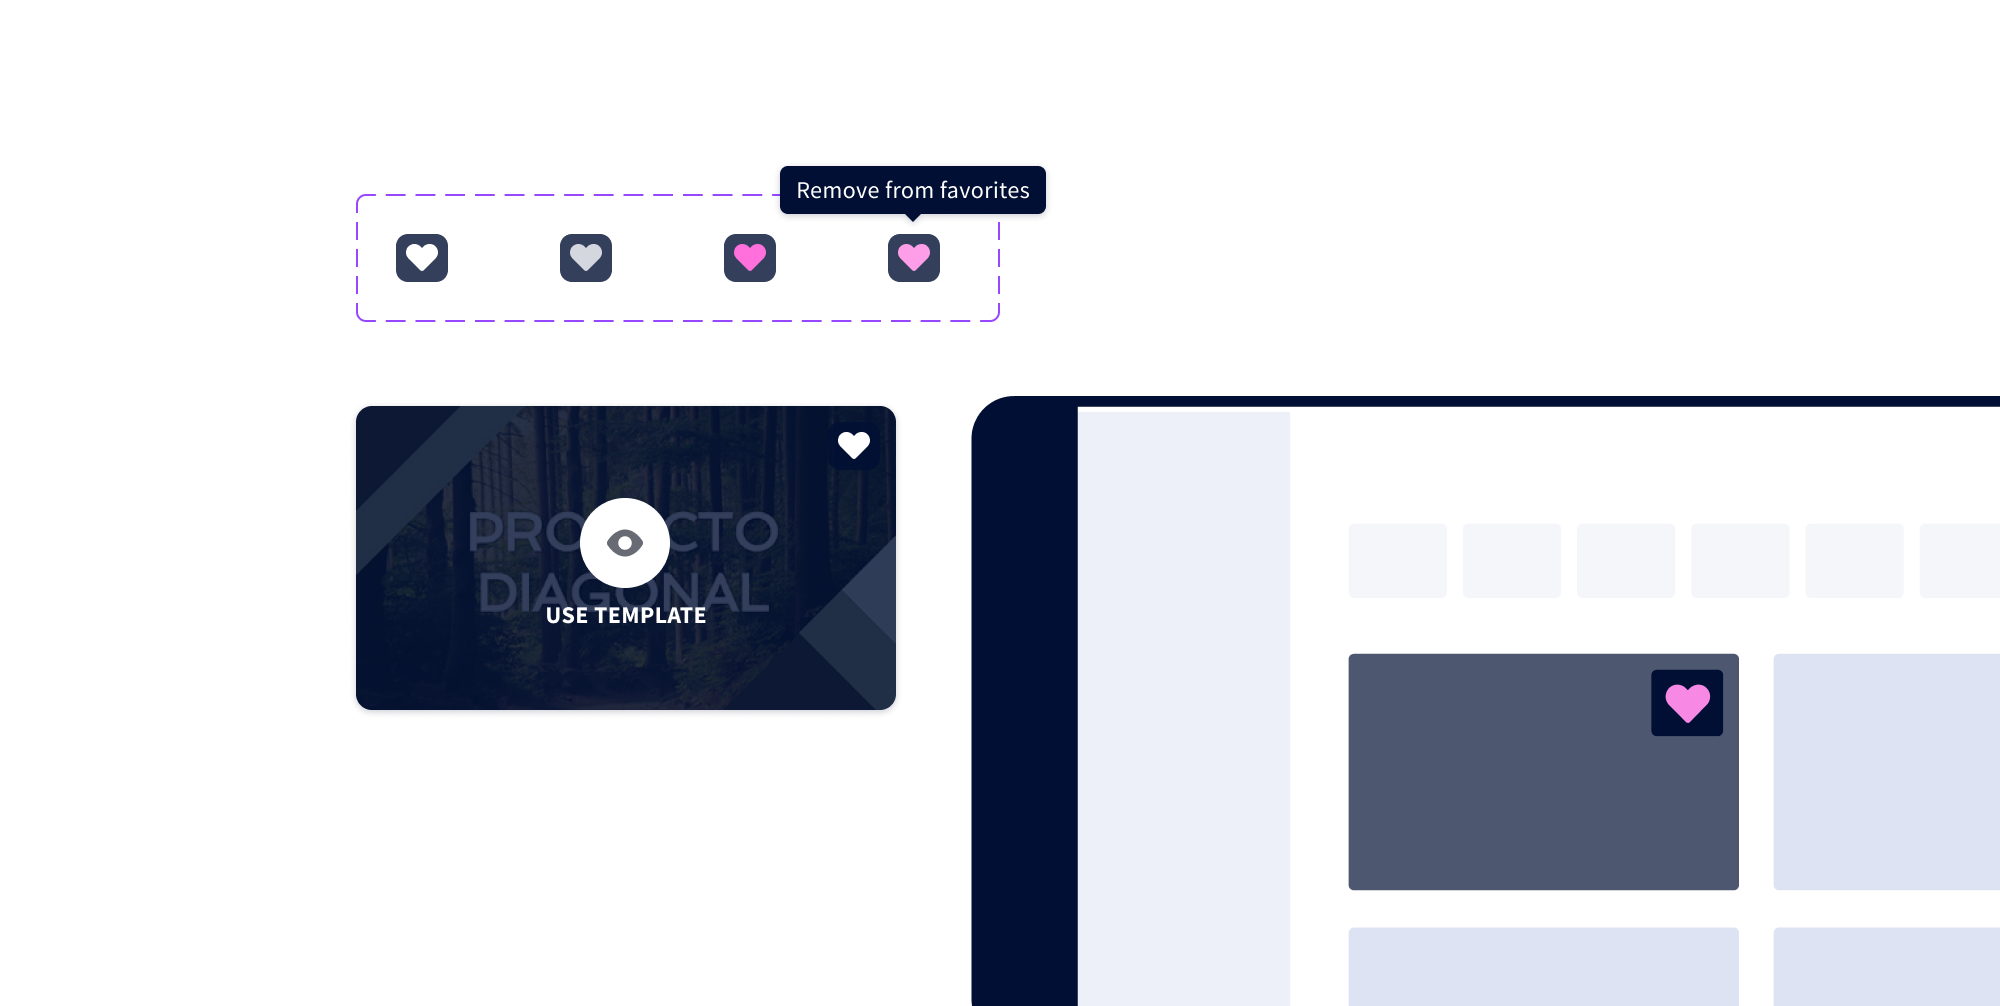
Add in the template card and in the preview modal a button that allows the user to bookmark/unbookmark the template and to place a section where the bookmarked ones can be consulted.
Prototype and test
Design system
At the same time as we were defining and designing the proposal, the design system squad was redesigning the component card. So we had a meeting to reconcile the proposals and come up with a design that met each squad's objectives.
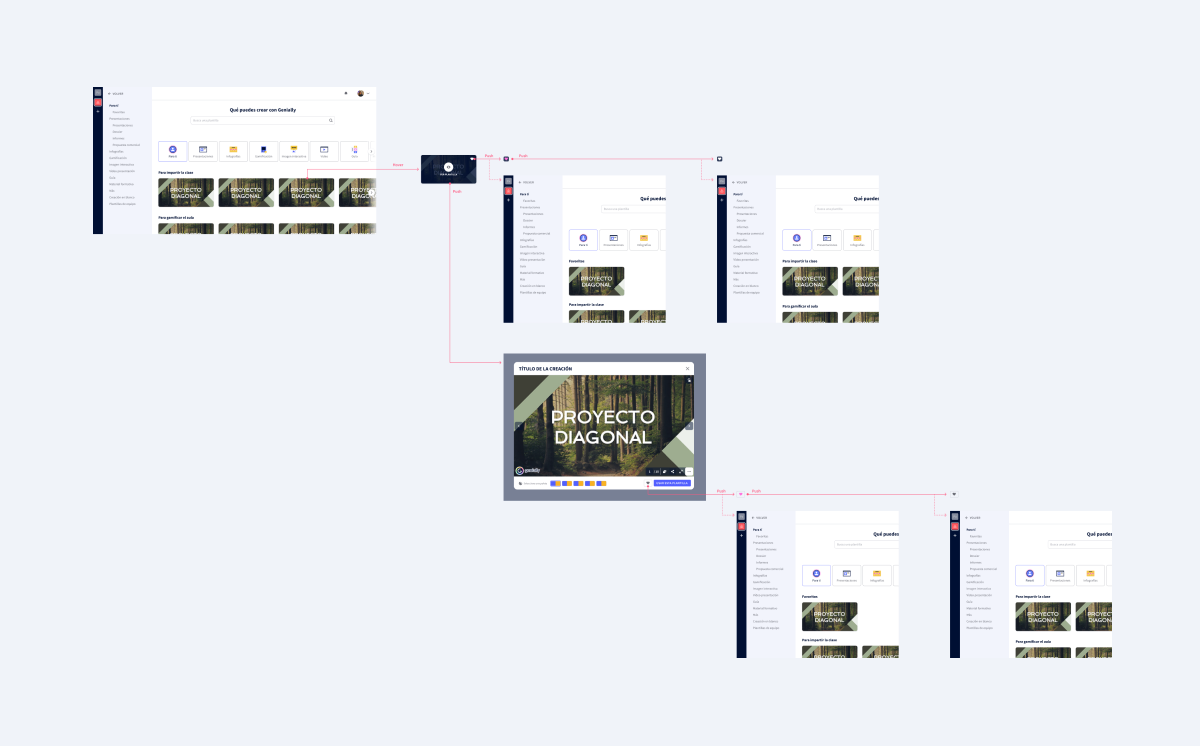
Prototyping
The prototype was easy to create because we were very clear about what we wanted to achieve with it; that stakeholders would understand the proposal and that we could test with users the ease of understanding and use of the solution.
Press on the image to use the prototype in Figma
User testing
To make sure that the proposal was clearly understood by the users, I decided to launch an open task test from within the tool, the task being to mark a template as a favourite and then find the Favourites section. After 2 days the test was completed by 50 people, more than 70% were successful on the first attempt, 20% on the second, the remaining users took three attempts or skipped the test.
-
Once we had established that most users could easily understand the action in the test, we were able to move on to the details and use cases of the proposal.
Develop
Hand off
Once the proposal was defined, designed and shared with the rest of the team, I delivered the figma document with all the design details and use cases.
Launch and measure
Due to the complexity of the experiment, we could not do an A/B test. There were technical problems in saving the favourites. So we decided to launch and measure. The data shown represents the first 22 days after launch.
Action of marking a template as Favorite in the Genially panel
Results
DIRECT GOAL
+21.4%
creations per active user (2.8 creations)
USER ENGAGEMENT
43%
of users who tried favourites would use the feat again
USER ENGAGEMENT
54%
of users find favourites on their first login
USER RETENTION
+10.6 p.p
return rate the day after account creation of users using favourites
USER EXPERIENCE
55%
of users who use bookmarks do so via the preview mode
USER EXPERIENCE
97%
of feat users who preview a template previously added to favourites end up creating it
Key learnings
Sharing progress
By communicating the status of the project with the other designers, we were able to progress the proposal with consensus and without problems with the design system
Better plan the test
I had several misconceptions when developing the prototype, I did not define the test outcomes well and I had to delay the launch of the test
Next steps
During the same quarter and the following quarter, we were able to implement other solutions that emerged from the other hypotheses formulated in this exercise. These included the template preview modal, changes to the filters and improvements to the architecture of the results page.
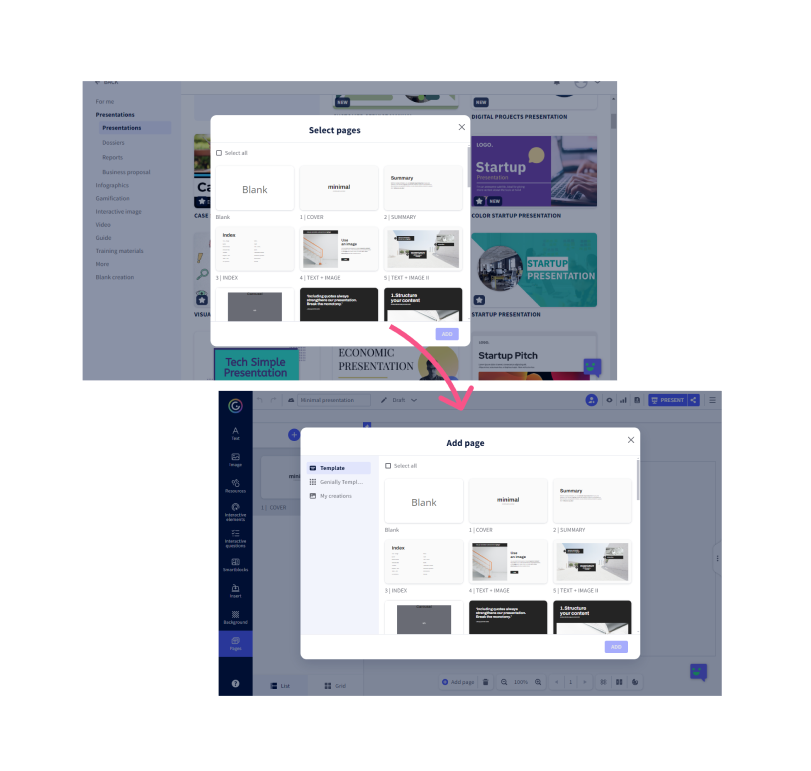
Move the page selection step of the presentation to the Editor
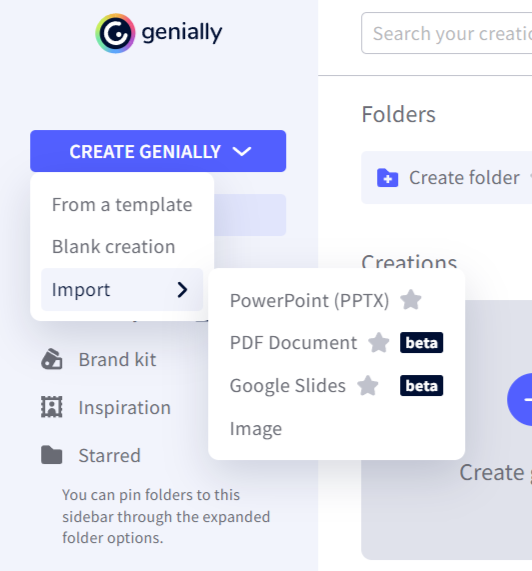
Display creation types in the main CTA of the dashboard
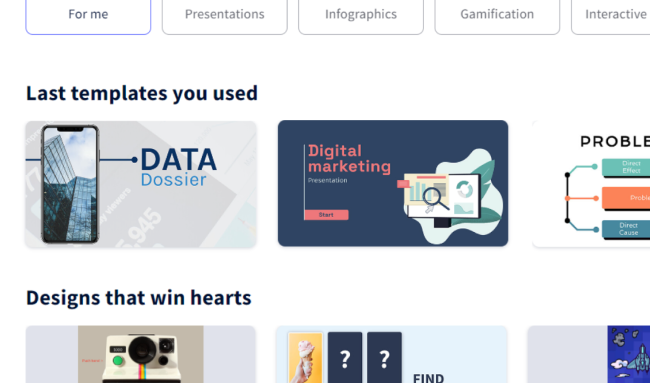
Row of recently used templates at the beginning of the process
